AI Agent Production Debugging Guide for Real-Time Issue Resolution
Last Updated on July 20, 2026 by Editorial Team
Author(s): David Pradeep
Originally published on Towards AI.
AI Agent Production Debugging Guide for Real-Time Issue Resolution
The pager goes off at 2 a.m., and suddenly you’re staring at a dashboard showing that your AI-powered customer recommendation engine has started returning empty results. Three hours earlier, it was working fine. No deploys happened. No infrastructure alerts fired. Yet there it sits, your most critical workflow, silently failing. I’ve been there more times than I care to count, and I’ve learned that debugging AI agents in production requires a different mindset than traditional software debugging.
Most engineers treat AI agents as black boxes because that’s what they are, complex systems where the internal logic can feel opaque. But here’s what I discovered after a particularly brutal weekend incident: AI agents are just another type of distributed system. Once I started applying the same systematic approach I’d use for microservices, transparency, traceability, and methodical isolation, the mystery failures became diagnosable problems.
This isn’t theoretical for me. At my first startup, a trading signal agent cost us $12,000 in thirty minutes because of a single off-by-one error in our risk calculation prompt. Later, I watched a multi-agent search pipeline collapse under load because we couldn’t correlate failures across agents. These experiences taught me that without a solid playbook, production AI systems become expensive liabilities rather than assets.
Classifying AI Agent Failure Modes in Production
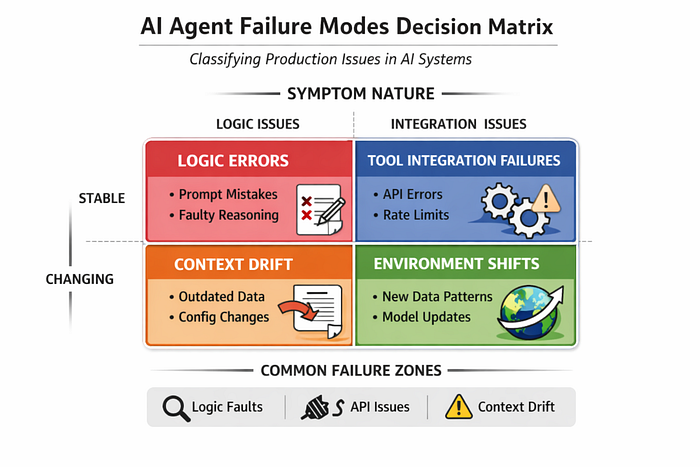
The first thing I do when an agent starts acting up is ask: where exactly is this breaking? I’ve narrowed it down to three buckets that cover about 85% of the incidents I’ve handled:
- Logic errors. Something’s wrong with the agent’s reasoning, maybe a prompt template changed, or a reward function isn’t aligning with business goals. I once spent six hours debugging what turned out to be a misplaced “not” in a negative prompt, causing our fraud detection agent to flag legitimate transactions instead of suspicious ones.
- Tool integration failures. The agent can’t talk to its downstream services. This might be rate limits, authentication issues, or APIs returning unexpected formats. During Black Friday, our inventory check agent kept failing because a third-party API was rate-limiting us more aggressively than documented.
- Context drift. The data or environment changed in ways the agent didn’t expect. Token limits shifting, new data distributions, or configuration files getting updated can all break assumptions that seemed solid during testing.
Getting good at this classification saves real time. Last month, our summarization agent started truncating outputs. Instead of diving into the prompt engineering, I recognized it as context drift, we’d deployed a new model version with different token handling, but forgot to update the configuration. Ten minutes to fix instead of ten hours to debug.

Instrumentation Strategies for Production Traces
Once I know where to look, I need data. My instrumentation stack captures three things:
- Decision traces: Every prompt sent, tool called, and model response received
- Tool call sequences: Timeline of external API interactions with all relevant metadata
- Context snapshots: Point-in-time copies of data the agent was working with
We use modified versions of OpenTelemetry for this. Here’s what our tracing wrapper looks like:
import traceify
from traceify import Trace

def call_external_api(payload):
 with Trace("external_api_call", context={"payload_size": len(str(payload))}) as t:
 t.add_event("request_started", data={"url": "https://api.example.com"})
 response = http.post("https://api.example.com", json=payload)
 t.add_event("response_received", data={
 "status": response.status_code,
 "response_size": len(response.text)
 })
 return response
The key is keeping overhead minimal. We sample heavily during normal operation and increase verbosity only when error rates spike. Every trace goes to our centralized collector as JSON, giving us replayable audit trails.
Real-Time Debugging with Embedded Debuggers
Production debuggers aren’t just for development anymore. When you need to understand why an agent makes a specific decision under real load, you can embed debugging capabilities directly into the service. LLDB works well for Python agents, we’ve configured it to break on custom signals and inspect call stacks mid-execution.
import lldb
import signal

def debug_handler(signum, frame):
 debugger = lldb.SBDebugger.Create()
 debugger.SetAsync(False)
 target = debugger.CreateTarget(None)
 process = target.Launchlldb.debugger.GetSelectedTarget()
 lldb_frame = process.GetSelectedFrame()
 print("Current decision state:", lldb_frame.FindVariable("current_decision"))

signal.signal(signal.SIGUSR1, debug_handler)

def agent_decision_loop():
 # Normal agent logic here
 # Send SIGUSR1 to trigger debugging when needed
 pass
This setup lets us pause execution, inspect variables, and even modify state without restarting the service. During a recent latency spike, we used this to discover our agent was stuck in an infinite loop caused by a malformed tool response.

Correlating Logs Across Multi-Agent Systems
When multiple agents work together, failure propagation becomes a nightmare. A planner agent sending bad input to an executor which then triggers validation failures requires stitching logs across services. We solved this by standardizing on trace context IDs.
Every log entry includes:
timestamp: ISO-8601 UTC formattrace_id: Shared across all agents in a workflowagent_id: Which agent generated this logevent_type: decision, tool_call, error, etc.payload: Structured JSON data
Last quarter, this approach saved us during a cascade failure. Our analytics showed a spike in validation errors, but the correlation dashboard revealed the root cause was upstream, our planner agent was generating malformed queries due to a schema change we hadn’t communicated properly.
Building Automated Safeguards
Prediction: you will miss something. So I always build automated circuit breakers. A simple health endpoint that tracks success rates, combined with automatic model rollback, has prevented several midnight escalations.
from flask import Flask, jsonify
import time

app = Flask(__name__)

# Rolling window of last 100 requests
request_history = []

@app.route("/health")
def health():
 if len(request_history) < 10:
 return jsonify({"status": "warming_up"})

 recent_success = sum(1 for r in request_history[-100:] if r['success'])
 rate = recent_success / min(len(request_history), 100)

 return jsonify({
 "circuit_state": "open" if rate < 0.7 else "closed",
 "success_rate": round(rate, 3),
 "requests_tracked": len(request_history)
 })

@app.route("/process", methods=["POST"])
def process():
 request_history.append({'success': False, 'timestamp': time.time()})

 try:
 # Agent execution logic
 result = run_agent()
 request_history[-1]['success'] = True
 return jsonify({"result": result})
 except Exception as e:
 request_history[-1]['error'] = str(e)
 return jsonify({"error": str(e)}), 500
When our circuit breaker trips, the orchestrator automatically rolls back to the previous known-good model version. We’ve had this kick in twice during major incidents, buying us time to properly investigate while maintaining service levels.
What Actually Works in Production
After months of running AI agents in production, here’s what I’ve learned: treat them like distributed systems, not magic. Yes, there’s uncertainty in the model outputs, but the infrastructure patterns that keep traditional services reliable work here too. You need observability, clear failure modes, and automated recovery paths.
The biggest mistake I see teams make is assuming their staging environment mirrors production. It doesn’t. AI agents are sensitive to data distribution, user behavior patterns, and downstream service reliability in ways that are hard to simulate. Invest in production-grade monitoring from day one.
Our current stack: Prometheus for metrics, Loki for log aggregation, Jaeger for distributed tracing, and a custom dashboard that combines all three with agent-specific visualizations. It took three months to get right, but it’s paid for itself dozens of times over in reduced downtime.
If you’re starting from scratch, begin with the health check endpoint and basic logging. Add sophisticated tooling as you scale. Don’t try to solve everything at once, incremental improvements beat perfect designs that never ship.
What production issues have caught you off guard? I’m curious how others are approaching this. Drop a comment below, we’re all figuring this out together.
Join thousands of data leaders on the AI newsletter. Join over 80,000 subscribers and keep up to date with the latest developments in AI. From research to projects and ideas. If you are building an AI startup, an AI-related product, or a service, we invite you to consider becoming a sponsor.
Published via Towards AI
Towards AI Academy
We Build Enterprise-Grade AI. We'll Teach You to Master It Too.
15 engineers. 100,000+ students. Towards AI Academy teaches what actually survives production.
Start free — no commitment:
→ 6-Day Agentic AI Engineering Email Guide — one practical lesson per day
→ Agents Architecture Cheatsheet — 3 years of architecture decisions in 6 pages
Our courses:
→ AI Engineering Certification — 90+ lessons from project selection to deployed product. The most comprehensive practical LLM course out there.
→ Agent Engineering Course — Hands on with production agent architectures, memory, routing, and eval frameworks — built from real enterprise engagements.
→ AI for Work — Understand, evaluate, and apply AI for complex work tasks.
Note: Article content contains the views of the contributing authors and not Towards AI.
Related posts
Recent Posts