I Cut 3 Hours of Weekly SRE Toil to 20 Minutes With Claude Code
Last Updated on July 30, 2026 by Editorial Team
Author(s): Moiz Ezzy
Originally published on Towards AI.
I Cut 3 Hours of Weekly SRE Toil to 20 Minutes With Claude Code

On a Thursday in May I spent 45 minutes writing a runbook for an alert I’d already written a runbook for twice, on two other services. Same structure, different service name. That was the moment I started tracking where my week actually went.
The answer was 3 hours. Three hours a week writing runbooks from a blank template, generating boilerplate Terraform, hand-building kubectl commands I'd typed a hundred times, and drafting postmortem docs while I was still tired from the incident.
None of it needed judgment. All of it needed time. And all of it is exactly what Claude Code is built for.
Six weeks later that 3 hours is 20 minutes. This is every workflow I changed the exact prompts, the exact CLAUDE.md, and the two things I still refuse to hand it.
What Claude Code Actually Is (And Why It’s Different)
Most AI coding tools are IDE assistants autocomplete that got smarter. GitHub Copilot started there and grew into agent workflows. Cursor is an IDE built around AI. Both are excellent at what they do.
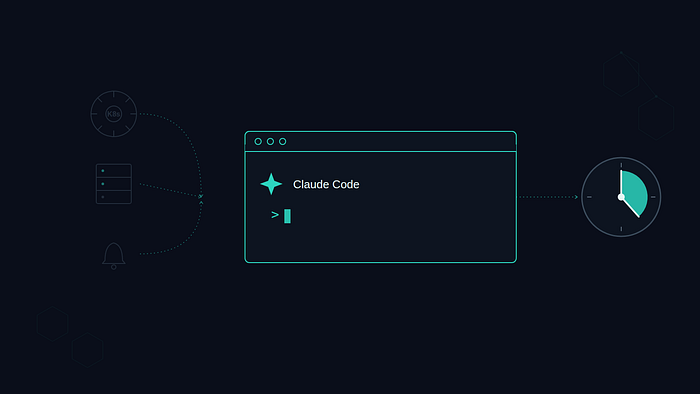
Claude Code is different. It’s terminal-native, built as an agent, and it runs real commands on your machine with your approval. Not suggestions. Actual execution: reading files, running shell commands, editing configs, calling kubectl, running terraform plan. Because it runs in your shell, it uses the same SSH keys, cloud credentials, and kubeconfig you already have loaded.
One thing to be clear about up front: it asks before it acts. Every command surfaces a permission prompt the first time you approve it, deny it, or allow that command going forward. Nothing runs behind your back. That gate is the whole reason I trust it near infrastructure at all.
That distinction matters for SRE work. Most of what I needed to automate wasn’t “write me a function.” It was “read this log, build a runbook for this alert, generate a Terraform module that matches our existing patterns, write a postmortem based on this incident timeline.”
Tasks that span multiple files, require context from your actual codebase, and produce outputs that plug directly into your existing workflow. That’s Claude Code’s home territory.
The pricing, as of July 2026:
- Pro: $20/month — Claude Code included, good for getting started
- Max 5x: $100/month — 5x Pro’s usage limits, higher output limits
- Max 20x: $200/month — 20x Pro’s usage, for daily heavy use
(Check claude.com/pricing before you commit the tiers move.)
I run Max 5x. At $100/month it pays for itself if it saves 2 hours of engineer time a month. It saves me 3 hours a week.
Setup: The CLAUDE.md File That Changes Everything
Before any workflow, the single most impactful thing you can do is write a CLAUDE.md file in your repository root. This is a context file Claude Code reads at the start of every session your team conventions, your infrastructure patterns, your SRE standards.
Without it, Claude Code gives you generic outputs. With it, you get outputs that match your actual environment.
Here’s mine for an SRE repository:
# CLAUDE.md — SRE Infrastructure Repository
## Context
This is the SRE infrastructure repository for a multi-region AWS deployment.
Primary stack: EKS (Kubernetes 1.29), Terraform 1.8, Datadog for observability,
PagerDuty for alerting, GitHub Actions for CI/CD.
## Coding Conventions
- Terraform: modules in /modules, environments in /environments/{prod,staging,dev}
- Always use remote state (S3 backend + DynamoDB lock table)
- Tag every resource with: Environment, Team, Service, CostCenter
- No hardcoded values - use variables.tf for all configuration
- Kubernetes manifests: namespace per service, resource requests and limits required
## SRE Standards
- SLO targets: 99.9% availability for production services
- Alert thresholds: fire at 10% below SLO (i.e. P99 > 450ms when SLO is 500ms)
- Runbooks: stored in /runbooks/{service-name}/, named {alert-name}.md
- Postmortem template: /templates/postmortem.md
- All kubectl commands: use namespaces explicitly, never default namespace
## Incident Response
- Severity 1: customer-facing, paging the on-call immediately
- Severity 2: degraded, notify team channel
- Severity 3: internal only, ticket created
- Runbook format: Impact → Detection → Mitigation options → Escalation
## What NOT to Do
- Never run terraform apply without my explicit confirmation
- Never delete resources without listing them first
- Never commit credentials or secrets
- Always validate Terraform with terraform validate before showing output
This file runs at the start of every Claude Code session. It takes 20 minutes to write and affects every single output for the rest of time.
Workflow 1: Runbook Generation (45 min → 5 min)
Writing runbooks was my biggest time sink. Every new alert needs one. Every alert has the same structure but different content. I was writing them from a blank template every time.
Now I do this:
# In the repo root, start Claude Code
claude

# Prompt:
> I have a new PagerDuty alert: "EKS node memory utilisation > 85% for 10 minutes
> on cluster prod-us-east-1". Generate a runbook following our standard format
> in /runbooks/eks-nodes/high-memory.md. Include kubectl commands to diagnose
> the issue, common causes for our stack, and mitigation steps.
Claude Code reads the CLAUDE.md context, checks the existing runbooks in /runbooks/ for format consistency, then generates:
# EKS Node High Memory Utilisation
**Alert:** node_memory_utilisation > 85% for 10 minutes
**Severity:** 2 - degraded, notify team channel
**Service:** EKS cluster prod-us-east-1
## Impact
Node memory pressure can trigger pod evictions, causing service disruption
for workloads scheduled on the affected node.
## Detection
```bash
# Identify the affected node
kubectl get nodes -o wide | grep -v Ready
# Check memory pressure condition
kubectl describe node NODE_NAME | grep -A5 Conditions
# See which pods are consuming the most memory
kubectl top pods -A --sort-by=memory | head -20
# Check for OOMKilled pods in the last hour
kubectl get events -A --field-selector reason=OOMKilling \
 --sort-by='.lastTimestamp' | tail -20
Common Causes (prod-us-east-1 specific)
- Memory leak in the payment-service check for VmRSS growth over 6h
- JVM heap not bounded check Java services for -Xmx flags
- Batch job running on wrong node group check node selectors
- Embeddings service loading model into memory known issue #4821
Mitigation Options
The output includes our naming convention, uses our cluster name, references known issues from our incident history, and matches the exact format of our existing runbooks. I review it, make minor tweaks, commit it.

That used to take 45 minutes. It takes 5 now - mostly review time.
---

## Workflow 2: Terraform Module Generation (2 hours → 15 min)

New service needs infrastructure? That used to mean copying an existing module, renaming everything, hunting for the values I forgot to update, running `terraform validate` until it stopped complaining.

Now:

```bash
> We're adding a new microservice called "notification-service". It needs:
> - ECS Fargate task (1 vCPU, 2GB memory)
> - ALB target group (port 8080, health check /health)
> - RDS PostgreSQL (db.t3.medium, same VPC as existing services)
> - IAM role with access to SES and S3 bucket notifications-prod
> Generate the Terraform module in /modules/notification-service/ following
> our existing patterns.
Claude Code reads the existing modules in /modules/, understands the patterns how we structure variables, how we tag resources, where we put outputs and generates a complete module that matches.
# modules/notification-service/main.tf
# Generated by Claude Code — reviewed and approved by Moiz Ezzy
locals {
 service_name = "notification-service"
 common_tags = {
 Environment = var.environment
 Team = "platform"
 Service = local.service_name
 CostCenter = var.cost_center
 }
}
resource "aws_ecs_task_definition" "notification" {
 family = "${local.service_name}-${var.environment}"
 requires_compatibilities = ["FARGATE"]
 network_mode = "awsvpc"
 cpu = 1024
 memory = 2048
 execution_role_arn = aws_iam_role.ecs_execution.arn
 task_role_arn = aws_iam_role.notification_task.arn
 container_definitions = jsonencode([{
 name = local.service_name
 image = var.container_image
 essential = true
 portMappings = [{
 containerPort = 8080
 protocol = "tcp"
 }]
 healthCheck = {
 command = ["CMD-SHELL", "curl -f http://localhost:8080/health || exit 1"]
 interval = 30
 timeout = 5
 retries = 3
 startPeriod = 60
 }
 logConfiguration = {
 logDriver = "awslogs"
 options = {
 awslogs-group = "/ecs/${local.service_name}/${var.environment}"
 awslogs-region = var.aws_region
 awslogs-stream-prefix = "ecs"
 }
 }
 }])
 tags = local.common_tags
}
It uses our tag structure. It uses our naming convention. The IAM role has exactly the SES and S3 permissions I specified, nothing more. I run terraform validate, it passes first time, I review the plan.
The old process: 2 hours. The new process: 15 minutes plus review.
Workflow 3: Postmortem Drafting (1 hour → 10 min)
Postmortems are the worst kind of writing structured, emotionally loaded, time-sensitive. You’re doing it right after an incident when you’re tired, and it needs to be done before the details fade.
After an incident I now run:
> Draft a postmortem for the following incident:
>
> Date: July 14, 2026
> Duration: 47 minutes (02:14 - 03:01 UTC)
> Impact: payment-service returning 503 for 40% of checkout requests
> Root cause: RDS primary failover triggered by maintenance window,
>  connection pool not configured with retry logic
> Detection: PagerDuty alert at T+3 minutes (error budget burn rate)
> Resolution: Increased connection pool max_retries to 3,
>  added exponential backoff in payment-service config
>
> Use our postmortem template and make it blameless.
> Include a timeline, contributing factors, and action items.
Claude Code reads /templates/postmortem.md, uses the incident details, and produces a structured draft with timeline, contributing factors, and action items blameless framing throughout.
I spend 10 minutes adding colour and specifics only I know. The structure, the timeline, the action item format — all done.
Workflow 4: kubectl Command Construction (ongoing → near-zero)
This sounds trivial but it adds up. I spend time constructing kubectl commands with the right flags, right namespaces, right output formats. Especially for less frequent commands I don't have memorised.
> Give me a kubectl one-liner that shows all pods in the payments namespace
> that have been restarted more than 3 times in the last hour, sorted by
> restart count, including the node they're running on.
Response in 3 seconds:
kubectl get pods -n payments \
 -o custom-columns="NAME:.metadata.name,RESTARTS:.status.containerStatuses[0].restartCount,NODE:.spec.nodeName" \
 --sort-by='.status.containerStatuses[0].restartCount' | \
 awk 'NR==1 || $2 > 3'
I could figure this out in 4–5 minutes. Claude Code does it in seconds. For 10 commands a day, that’s 40–50 minutes back.
One honest caveat, because it’s the point of the whole article: restartCount is cumulative, not "last hour" so this filters total restarts, not restarts in the window. I caught that on the read-through and asked it to add a --field-selector on recent events instead. The tool is fast; you're still the one who has to know what "correct" looks like.
Workflow 5: Alert Rule Generation
New service going into production needs Prometheus alert rules. The old process: find a similar service, copy the rules, edit the thresholds, remember which labels to use, write the runbook annotations.
> Generate Prometheus alert rules for the notification-service we just created.
> It should alert on:
> - Error rate > 1% for 5 minutes (Severity: warning) and > 5% for 2 minutes (critical)
> - P99 latency > 500ms for 5 minutes
> - Pod restart count > 3 in 1 hour
> Use our existing alert format from /monitoring/alerts/payment-service.yaml as reference.
Claude Code reads the payment-service alert file, matches the format, and generates:
# monitoring/alerts/notification-service.yaml
groups:
 - name: notification-service
 rules:
 - alert: NotificationServiceHighErrorRate
 expr: |
 sum(rate(http_requests_total{
 service="notification-service",
 status_code=~"5.."
 }[5m])) /
 sum(rate(http_requests_total{
 service="notification-service"
 }[5m])) > 0.01
 for: 5m
 labels:
 severity: warning
 team: platform
 service: notification-service
 annotations:
 summary: "notification-service error rate above 1%"
 description: "Error rate is {{ $value | humanizePercentage }} over 5 minutes"
 runbook_url: "https://runbooks.internal/notification-service/high-error-rate"
- alert: NotificationServiceCriticalErrorRate
 expr: |
 sum(rate(http_requests_total{
 service="notification-service",
 status_code=~"5.."
 }[2m])) /
 sum(rate(http_requests_total{
 service="notification-service"
 }[2m])) > 0.05
 for: 2m
 labels:
 severity: critical
 team: platform
 service: notification-service
 annotations:
 summary: "notification-service critical error rate"
 description: "Error rate is {{ $value | humanizePercentage }} - page immediately"
 runbook_url: "https://runbooks.internal/notification-service/high-error-rate"
 - alert: NotificationServiceHighLatency
 expr: |
 histogram_quantile(0.99,
 sum(rate(http_request_duration_seconds_bucket{
 service="notification-service"
 }[5m])) by (le)
 ) > 0.5
 for: 5m
 labels:
 severity: warning
 team: platform
 annotations:
 summary: "notification-service P99 latency above 500ms"
 runbook_url: "https://runbooks.internal/notification-service/high-latency"
Labels match our format.
Thresholds match what I specified.
Runbook URLs follow our naming convention.
This used to take 30 minutes. It takes 3.
What Claude Code Won’t Replace
I want to be direct about this: Claude Code is not a replacement for SRE judgment.
It doesn’t know whether a terraform destroy is safe to run. It doesn't know whether the alert threshold you asked it to set is actually right for your traffic patterns. It doesn't know the organisational context of why your team made a specific architecture decision three years ago.
Three things I don’t use it for:
Incident command. During an active incident, I don’t want an AI making decisions. The cognitive overhead of reviewing AI outputs when things are on fire is worse than just typing the commands myself. Claude Code is for the work before and after incidents, not during them.
Anything touching production state directly. My CLAUDE.md explicitly tells Claude Code never to run terraform apply without my confirmation. I review every plan. I approve every deployment. The automation is in the generation, not the execution.
Code review for critical paths. Payment flows, auth flows, anything security-relevant I read that code myself. Claude Code can suggest improvements, but the judgment call on whether to merge stays with me.
The Real Benefit: Cognitive Load
The hours saved are real. But the bigger win is harder to measure.
Toil isn’t just slow it’s distracting. When I spend 45 minutes writing a runbook, I’m not just spending time. I’m context-switching away from the work that requires actual judgment: reliability architecture, SLO design, incident retrospectives, infrastructure planning.
Delegating the structured, repeatable parts to Claude Code means more of my working hours are spent on the work that actually needs a senior engineer. Not because the other work isn’t important it is but because it doesn’t need me specifically.
That’s the real ROI. Not 3 hours saved. 3 hours of low-judgment work replaced by 3 hours of high-judgment work. At $100/month, it’s the best infrastructure investment I made this year.
Getting Started — The 30-Minute Setup
If you want to replicate this for your own SRE workflow:
# Install Claude Code
npm install -g @anthropic-ai/claude-code
# Or via Homebrew (the --cask flag is required)
brew install --cask claude-code
# Start a session in your repo - first run opens a browser to log in
cd your-infra-repo
claude
There’s no separate claude auth step. The first time you run claude, it opens a browser window for you to log in with your Anthropic account (Pro, Max, or Console). Once you're in, it stays authenticated.
Then write your CLAUDE.md. That's the step most people skip and the one that matters most. Spend 20 minutes documenting:
- Your stack (cloud provider, orchestration, observability tools)
- Your naming conventions and file structure
- Your SRE standards (SLO targets, alert thresholds, severity levels)
- What Claude Code should never do without confirmation
After that, start with the lowest-risk workflow: runbook generation. It has no side effects, the output is easy to review, and the time savings are immediate.
Key Takeaways

- CLAUDE.md is the setup that matters most. Without context, you get generic outputs. With it, you get outputs that match your actual environment.
- Start with generation, not execution. Runbooks, Terraform modules, alert rules outputs you review before using. Not commands that execute directly.
- Toil reduction compounds. 3 hours/week × 50 weeks = 150 hours/year. At a senior SRE hourly rate, that’s real money.
- The cognitive load reduction matters more than the time. Delegating structured work frees judgment capacity for work that actually needs a senior engineer.
- Claude Code at $100/month pays for itself in under a week if your time is worth anything. The question isn’t whether to use it it’s which workflows to automate first.
- It won’t replace SRE judgment. Production incidents, critical code review, architecture decisions those stay with you. The tool is for the work around the judgment, not the judgment itself.
If you carry a pager, the same instinct behind these workflows shows up in The nine Linux commands I actually run at 2AM the difference between reaching for the right thing in the dark and Googling under pressure.
Next in this series: wiring Claude Code into a CI/CD pipeline so runbooks and alert rules generate automatically when a new service ships — no human in the loop for the boilerplate.
If this saved you an afternoon of toil, a clap help’s TowardsAI show it to more on-call engineers. Follow if you want the CI/CD automation piece when it lands.
Join thousands of data leaders on the AI newsletter. Join over 80,000 subscribers and keep up to date with the latest developments in AI. From research to projects and ideas. If you are building an AI startup, an AI-related product, or a service, we invite you to consider becoming a sponsor.
Published via Towards AI
Towards AI Academy
We Build Enterprise-Grade AI. We'll Teach You to Master It Too.
15 engineers. 100,000+ students. Towards AI Academy teaches what actually survives production.
Start free — no commitment:
→ 6-Day Agentic AI Engineering Email Guide — one practical lesson per day
→ Agents Architecture Cheatsheet — 3 years of architecture decisions in 6 pages
Our courses:
→ AI Engineering Certification — 90+ lessons from project selection to deployed product. The most comprehensive practical LLM course out there.
→ Agent Engineering Course — Hands on with production agent architectures, memory, routing, and eval frameworks — built from real enterprise engagements.
→ AI for Work — Understand, evaluate, and apply AI for complex work tasks.
Note: Article content contains the views of the contributing authors and not Towards AI.
Related posts
Recent Posts